A sales analysis is a detailed report that shows a business’s sales performance, as well as customer data and generated revenue.
The report defines the strengths and weaknesses of products and sales teams by referencing historical and current metrics to detect emerging trends that are most relevant to a company.
Typically, a sales analysis is mostly comprised of quantitative data, such as key performance indicators (KPIs) and charts. Here we are going to find insights about those KPI’S :
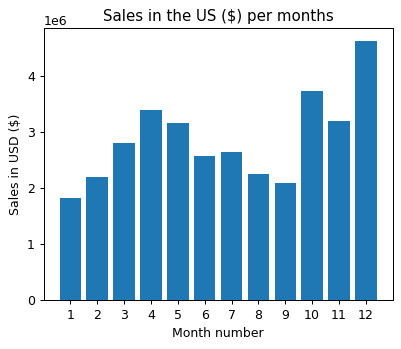
Sales per month
Sales Per city
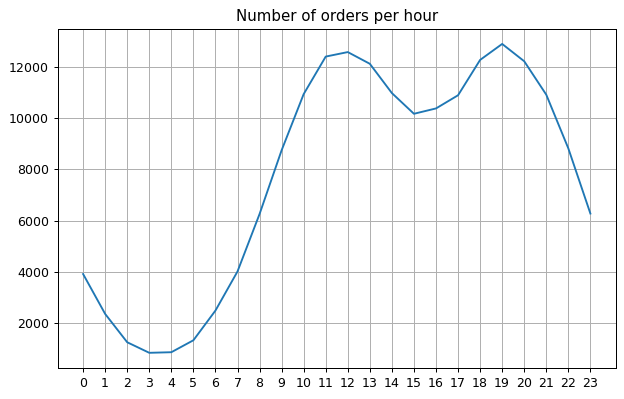
Number of orders per hour
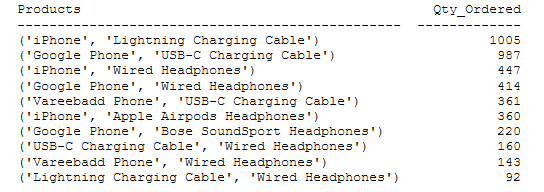
Products most often sold together
Which products are sold the most with a price correlation
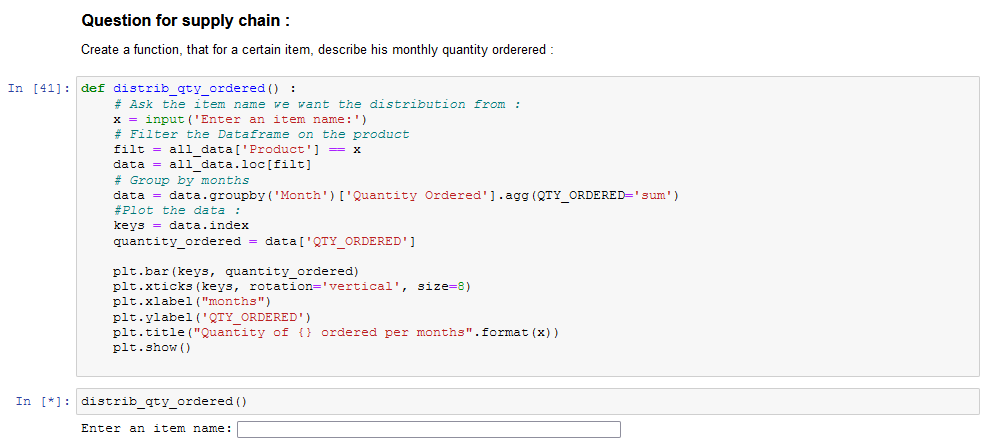
I also created a little function that allows an employee to enter an item and returns a graph of the quantity ordered per months for this specific item.
Extract the price in dollar from 11$ to float(11.0)
Groupby Month and aggregate with sum()
A trend is appearing here around May and by the end of the year.
Description : Sales in the US per city
Method :
Creating a city attribute by splitting the address
Groupby city and aggregate with sum() on sales
For this business it’s pretty clear that SF, LA and NYC are the top cities to sell your products.
A deeper analysis can explain why those cities are the main costumer, higher wages ? different purchasing behavior ?
Description : Number of orders per hour
Method :
Parsing the order hour with datetime
Groupby hour and aggregate with count()
This insight can be useful for advertising or promotion campaigns, giving insight on when to infiltrate the media environment of a lambda person when it’s the highest probability of purchase.
Description : Products that are mostly sold together
Method :
First create df, a Dataframe created with only the rows who match another row on the Order Id feature
select rows if the Orderid attribute appear several time
Create the attribute ‘Grouped’,where the products belonging to the same OrderId are being joined.
Again this insight can be useful for advertising or promotion campaigns, ie it is probably a good idea to sell packs of products together that people are willing to buy as a way to generate more sales than selling all products separately.
Description : Number of orders per products during a full year and their price
Method :
One groupby product and sum of orders
groupby products and aggg with average price
There is a clear correlation (We don’t know if it’s causation here) between price and quantity ordered.
But clearly it’s not the full story since some products are bought way more often just by the nature of their utilization (AAA batteries)
Description : Number of orders per products and per month
This can be a useful application regarding supply chain, even if it’s very basic you can potentially extract information about the yearly purchase distribution for each products.


You need to get upset! Get motivated and get pissed off. Now this will let you take the next steps to becoming successful.